

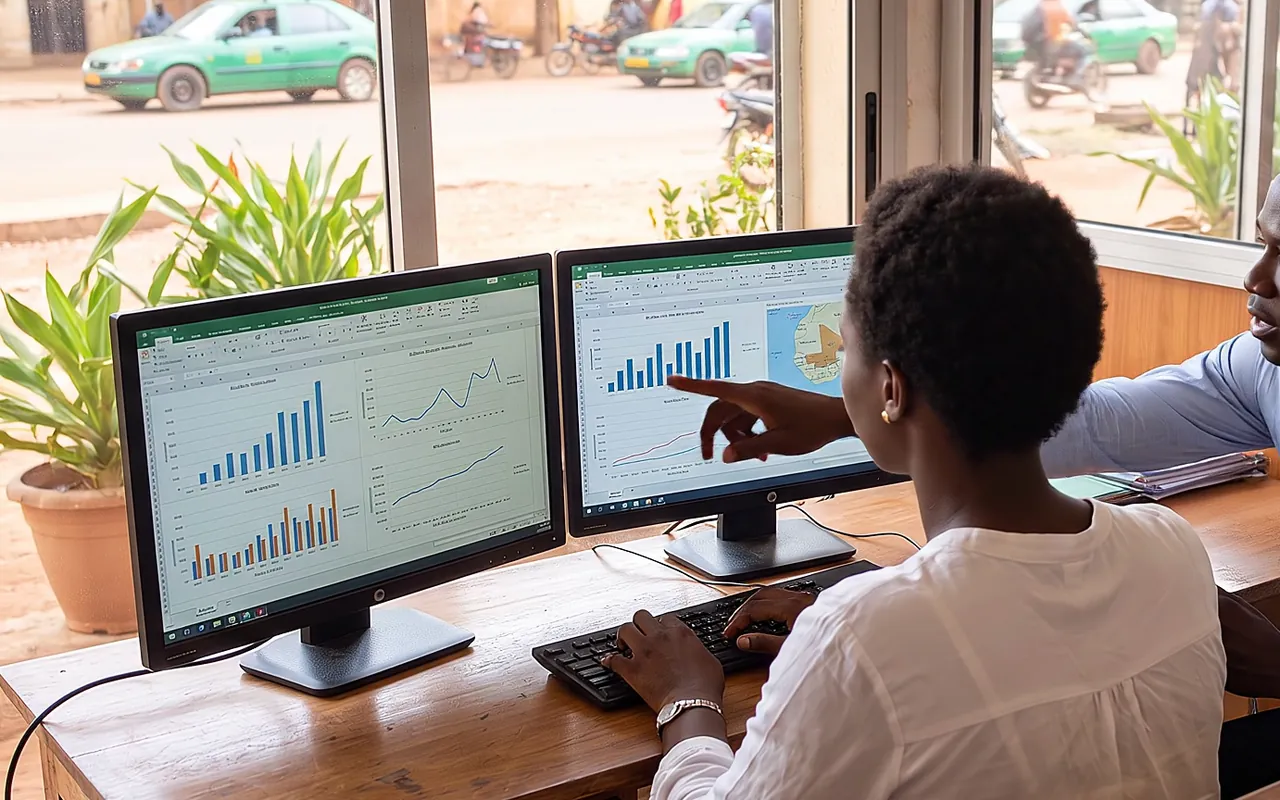
Your accounting, sales and payroll systems produce data every day that often goes largely unused. We bring it together, check it and analyse it to inform your decisions: management dashboards, margin and cost analysis, cash monitoring and anomaly detection. In audit work, data analysis makes it possible to examine every entry of a financial year rather than a sample, and to focus the work on unusual transactions.
Four uses of data analysis
Dashboards
Indicators agreed with management, fed automatically from your systems and updated as often as needed.
Journal entry analysis
A review of every accounting entry: manual entries, entries posted outside normal hours, round amounts, duplicates, unusual counterparts.
Performance analysis
Margins by product, customer or site, cost prices, budget variances and trends, to understand what drives your results.
Forecasts
Projections of revenue, cash and requirements, built on your history and assumptions, with their limitations stated.
What we do
- Assessment of the available data: sources, quality, update frequency and owners.
- Definition of management indicators with senior management and operational managers.
- Design and deployment of dashboards (Metabase, Apache Superset or the tool already used in your organisation).
- Analysis of accounting entries and automated tests in support of audit and internal audit engagements.
- Profitability, cost price and budget variance analyses.
- Forecasting models for revenue, cash and financing needs.
- Training of your teams to read and use dashboards.
Our approach
Understand
We identify the decisions to inform and the questions the data must answer.
Prepare
Data is extracted, checked, reconciled with the accounts and documented.
Analyse
Analyses and indicators are built, then validated with your teams.
Report
Results are presented in dashboards and notes that state sources and limitations.
Reports and deliverables
- Map of the data and its sources.
- Indicator dictionary, with calculation rules.
- Dashboards in production, updated automatically.
- Analysis notes and recommendations.
